Multi-Wavelength Photometry System
The Multi-Wavelength Photometry System builds on the technology of the legacy single wavelength photometry system and incorporates new features based on customer feedback.
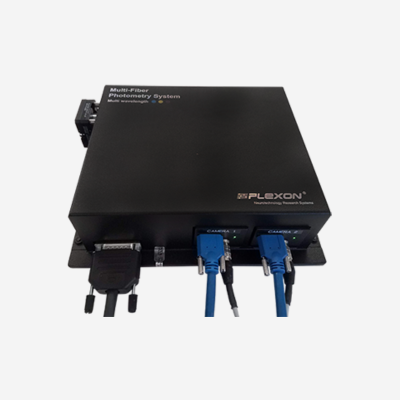
Plexon’s multi-wavelength photometry system has the capability to deliver multiple wavelengths of excitation light and the ability to detect multiple wavelengths of emitted light. The photometry system offers three excitation ranges centered at 560 nm, 465 nm, and 410 nm and two detection ranges centered at 600 nm and 525 nm. These ranges were chosen to operate with two of the most popular genetically encoded calcium indicators, GCaMP6 and R‑CaMP2.
Multi-Wavelength Photometry System
The Multi-Wavelength Photometry System builds on the technology of the legacy single wavelength photometry system and incorporates new features based on customer feedback.
Plexon’s multi-wavelength photometry system has the capability to deliver multiple wavelengths of excitation light and the ability to detect multiple wavelengths of emitted light. The photometry system offers three excitation ranges centered at 560 nm, 465 nm, and 410 nm and two detection ranges centered at 600 nm and 525 nm. These ranges were chosen to operate with two of the most popular genetically encoded calcium indicators, GCaMP6 and R‑CaMP2.
Multi-Wavelength and Multi-Fiber Photometry
System Features
- LED scheduler reduces risk of photobleaching
- Record from multiple locations in a single animal or many animals simultaneously with a single system
- Three excitation ranges centered at 560 nm, 465 nm, and 410 nm
- Detect fluorescence at 525 nm and 600 nm using two detection cameras
- Synchronize photometry signals with behavioral events
- Incorporated LED driver
- Integrated with video tracking software

465 nm for selectively activating GCaMP6
560 nm for selectively activating RCaMP2
410 nm for use as an isosbestic control to detect calcium-independent signals
Selected technical specifications for Plexon’s Multi-Wavelength Photometry system are provided below. A Plexon Sales Engineer is happy to discuss your needs and how this product could best support your research goals
.
Photometry Module
| Excitation wavelength | 410 nm, 465 nm , 560 nm |
| Detection wavelength | 505-545 nm, 580-620 nm |
| Number of Fibers | Up to 4 |
| LED driver | Yes, four high current LED drivers |
| Trigger Interfaces | Yes, eight camera trigger interfaces |
| Digital Inputs | 12 |
| Digital Outputs | 12 |
| Timing Interface | Yes |
| SPI Interface | Yes |
Behavioral Camera
| Resolution | 640 (H) x 480 (V) |
| Max frame rate at full resolution | 30fps |
Can I measure neural activity in real time using fiber photometry?
Yes, fiber photometry provides the most sensitive and easiest way to record neuronal activities of the deep brain structures in behaving animals. GCaMP can be used to tag cell-type specific neurons with engineered fluorescent proteins and then measure the levels of fluorescence in response to changes in intracellular calcium concentration. The fluorescence emission of the GCaMP indicator increases with elevating calcium concentration. Fiber photometry enables the researcher to record the neural activity of genetically defined subpopulations of neurons through an optic fiber in freely moving animals.
I am interested in recording from multiple animals simultaneously. Is this possible?
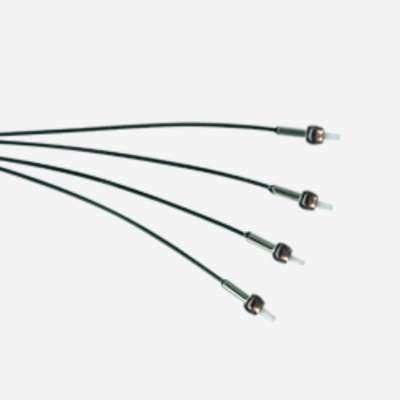
Yes, the branching patch cable terminates in 4 magnetic LC ferrules. Each of these ferrules can be attached to fiber stubs on different animals.
Can I use dLight to detect changes in dopamine and a red-shifted Ca2+ indicator at the same time?
Yes, the 465 nm LED can be used for targeting dLight and the 560 nm LED can be used for activation of the red-shifted Ca2+ indicator. The emitted fluorescence will be collected independently by each detection camera.
Will I be able to view the photometry signal during recording?
Yes, the software included with the Plexon multi-wavelength system will show raw data for each fiber and for each detection camera. The software will also show a heat map for each fiber that illustrates changes in florescence for each fiber.
How is Plexon’s photometry system different from traditional systems?
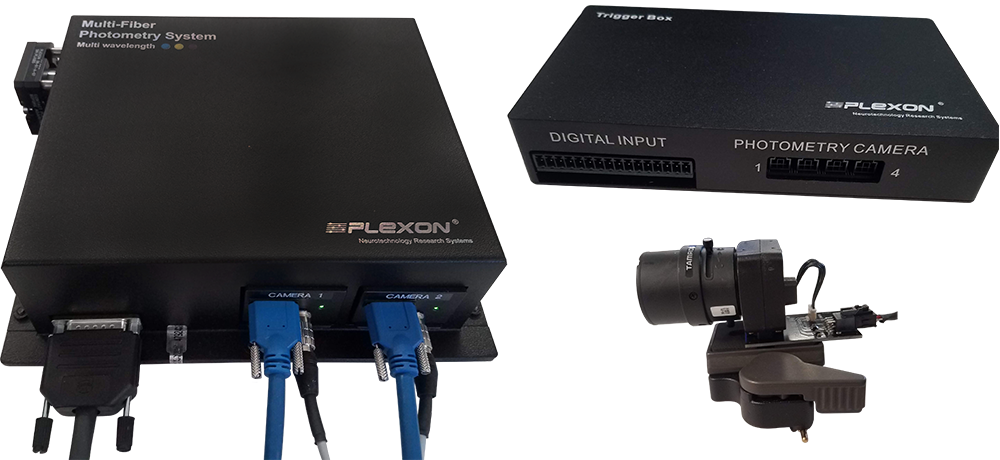
Traditional systems employ a single multimode optical fiber implanted in the brain, a beam splitter that separates the excitation light and the fluorescent signals of neuronal activity indicators returning through the same optical fiber, and a photodetector. This approach allows for imaging of one fiber at a time. Measuring multiple brain regions is crucial to investigate connection between different brain regions to produce behaviors and the neural correlates of social interaction. Plexon’s camera-based approach provides a cost effective means to image from multiple fibers with the same detector.
Can I measure neural activity in real time using fiber photometry?
- T-maze
- Fear conditioning
- Operant chamber
- Elevated plus maze
- Place preference
- Barnes maze
- Novel object recognition
- Social Interaction
- Radial arm maze
- Other behavioral paradigms
How do I know what type of fiber stubs I should use with my photometry system?
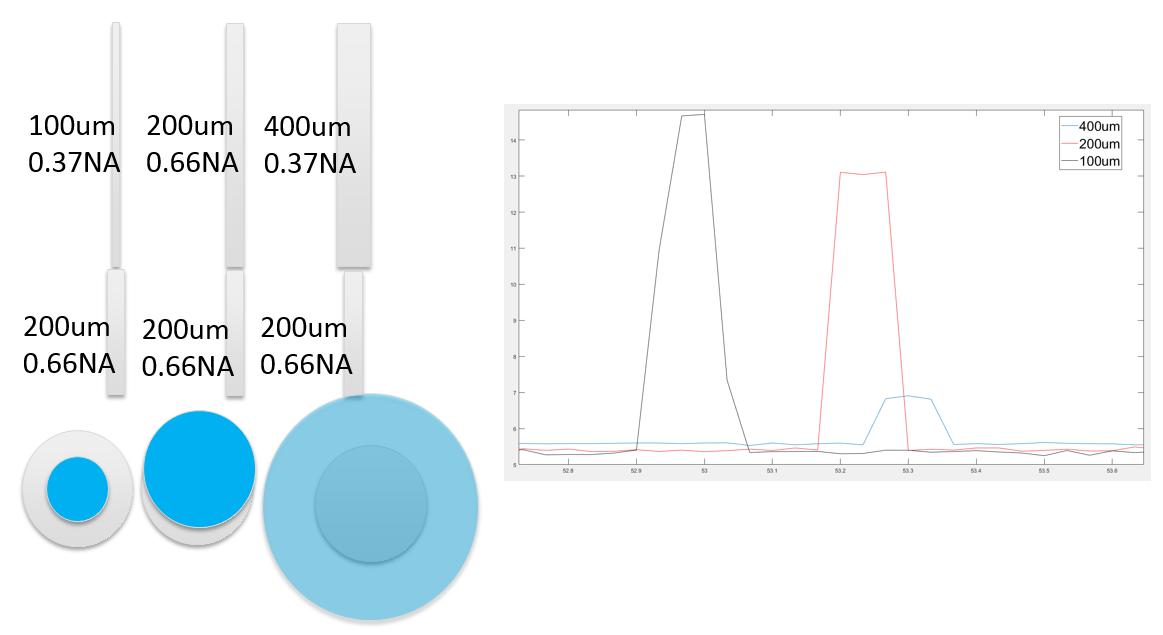
There are many options when choosing a fiber stub. Plexon recommends using fiber stubs with a diameter of either 200/225um or 225/245um, which are both larger diameters than the diameter of the fiber used in the branching patch cable. This combination allows for the highest average output in most cases. The diagram below illustrates the power output when various combinations of patch cables and fiber stubs are used. The depiction of the 100um patch cable with the 200um fiber stub is the solution that Plexon recommends for the highest average output.
What if magnetic fiber stubs will not work with my experimental design?
The magnetic branching photometry patch cable is made to easily attach to magnetic LC ferrules. However, this patch cable can also be connected to standard fiber stubs using a ceramic or metal sleeve.
Installation Packages/Upgrades
- Multi-Wavelength Photometry Version 1.3.0
- Multi-Wavelength Photometry Version 2.0.1.1 ****Upgrade Required
Change Log
- Multi-Wavelength Photometry Change Log Post date April 2025
Technical Specs and Data Sheets
- Multi-Wavelength Photometry User Guide
- Multi-Wavelength Photometry Data Sheet
- Multi-Wavelength Photometry Quick Start Guide
- Multiwavelength Photometry Release Notes
- Patch Cable Alignment
Support Videos
- Multi-Wavelength Multi-Fiber Photometry Quick Start Tutorial
- Multi-Wavelength Photometry Demo
- Multi-Wavelength Photometry: Tracking Behavior On Previously Recorded File
- pMAT vs GuPPY: Multi-Wavelength Photometry Open-Source Parts 1-4
- Neurophotonics Summer School 2022: Kristin Marquardt, PHD discusses photometry data analysis using pMAT and GuPPy
Additional Info
2024
- Bender, B. N., Stringfield, S. J., & Torregrossa, M. M. (2024). Changes in dorsomedial striatum activity during expression of goal-directed vs. habit-like cue-induced cocaine seeking. Addiction Neuroscience, 11, 100149.
- Kim, S., Kim, Y.-E., Yusuke Ujihara, & Il Hwan Kim. (2024). Monosynaptically-interconnected Network Module (MNM) Approach for High-Resolution Brain Sub-Network Analysis. BioRxiv (Cold Spring Harbor Laboratory).
2020
*Using Legacy CineLyzer with Single Wavelength Multi-Fiber Photometry System

Multi-Wavelength and Multi-Fiber Photometry
System Features
- Record from multiple locations in a single animal or many animals simultaneously with a single system
- Three excitation ranges centered at 560 nm, 465 nm, and 410 nm
- Detect fluorescence at 525 nm and 600 nm using two detection cameras
- Synchronize photometry signals with behavioral events
- Incorporated LED driver
- Integrated with video tracking software
- LED scheduler reduces risk of photobleaching
465 nm for selectively activating GCaMP6
560 nm for selectively activating RCaMP2
410 nm for use as an isosbestic control to detect calcium-independent signals
Selected technical specifications for Plexon’s Multi-Wavelength Photometry system are provided below. A Plexon Sales Engineer is happy to discuss your needs and how this product could best support your research goals
.
Photometry Module
| Excitation wavelength | 410 nm, 465 nm , 560 nm |
| Detection wavelength | 505-545 nm, 580-620 nm |
| Number of Fibers | Up to 4 |
| LED driver | Yes, four high current LED drivers |
| Trigger Interfaces | Yes, eight camera trigger interfaces |
| Digital Inputs | 12 |
| Digital Outputs | 12 |
| Timing Interface | Yes |
| SPI Interface | Yes |
Behavioral Camera
| Resolution | 640 (H) x 480 (V) |
| Max frame rate at full resolution | 30fps |
Can I measure neural activity in real time using fiber photometry?
Yes, fiber photometry provides the most sensitive and easiest way to record neuronal activities of the deep brain structures in behaving animals. GCaMP can be used to tag cell-type specific neurons with engineered fluorescent proteins and then measure the levels of fluorescence in response to changes in intracellular calcium concentration. The fluorescence emission of the GCaMP indicator increases with elevating calcium concentration. Fiber photometry enables the researcher to record the neural activity of genetically defined subpopulations of neurons through an optic fiber in freely moving animals.
I am interested in recording from multiple animals simultaneously. Is this possible?
Yes, the branching patch cable terminates in 4 magnetic LC ferrules. Each of these ferrules can be attached to fiber stubs on different animals.
Can I use dLight to detect changes in dopamine and a red-shifted Ca2+ indicator at the same time?
Yes, the 465 nm LED can be used for targeting dLight and the 560 nm LED can be used for activation of the red-shifted Ca2+ indicator. The emitted fluorescence will be collected independently by each detection camera.
Will I be able to view the photometry signal during recording?
Yes, the software included with the Plexon multi-wavelength system will show raw data for each fiber and for each detection camera. The software will also show a heat map for each fiber that illustrates changes in florescence for each fiber.
How is Plexon’s photometry system different from traditional systems?
Traditional systems employ a single multimode optical fiber implanted in the brain, a beam splitter that separates the excitation light and the fluorescent signals of neuronal activity indicators returning through the same optical fiber, and a photodetector. This approach allows for imaging of one fiber at a time. Measuring multiple brain regions is crucial to investigate connection between different brain regions to produce behaviors and the neural correlates of social interaction. Plexon’s camera-based approach provides a cost effective means to image from multiple fibers with the same detector.
Can I measure neural activity in real time using fiber photometry?
- T-maze
- Fear conditioning
- Operant chamber
- Elevated plus maze
- Place preference
- Barnes maze
- Novel object recognition
- Social Interaction
- Radial arm maze
- Other behavioral paradigms
How do I know what type of fiber stubs I should use with my photometry system?
There are many options when choosing a fiber stub. Plexon recommends using fiber stubs with a diameter of either 200/225um or 225/245um, which are both larger diameters than the diameter of the fiber used in the branching patch cable. This combination allows for the highest average output in most cases. The diagram below illustrates the power output when various combinations of patch cables and fiber stubs are used. The depiction of the 100um patch cable with the 200um fiber stub is the solution that Plexon recommends for the highest average output.
What if magnetic fiber stubs will not work with my experimental design?
The magnetic branching photometry patch cable is made to easily attach to magnetic LC ferrules. However, this patch cable can also be connected to standard fiber stubs using a ceramic or metal sleeve.
Installation Packages/Upgrades
- Multi-Wavelength Photometry Version 1.3.0
- Multi-Wavelength Photometry Version 2.0.1.1 ****Upgrade Required
Change Log
- Multi-Wavelength Photometry Change Log Post date May 2025
Technical Specs and Data Sheets
- Multi-Wavelength Photometry User Guide
- Multi-Wavelength Photometry Data Sheet
- Multi-Wavelength Photometry Quick Start Guide
- Multiwavelength Photometry Release Notes
- Patch Cable Alignment
Support Videos
- Multi-Wavelength Multi-Fiber Photometry Quick Start Tutorial
- Multi-Wavelength Photometry Demo
- Multi-Wavelength Photometry: Tracking Behavior On Previously Recorded File
- pMAT vs GuPPY: Multi-Wavelength Photometry Open-Source Parts 1-4
- Neurophotonics Summer School 2022: Kristin Marquardt, PHD discusses photometry data analysis using pMAT and GuPPy
Additional Info
2024
- Bender, B. N., Stringfield, S. J., & Torregrossa, M. M. (2024). Changes in dorsomedial striatum activity during expression of goal-directed vs. habit-like cue-induced cocaine seeking. Addiction Neuroscience, 11, 100149.
- Kim, S., Kim, Y.-E., Yusuke Ujihara, & Il Hwan Kim. (2024). Monosynaptically-interconnected Network Module (MNM) Approach for High-Resolution Brain Sub-Network Analysis. BioRxiv (Cold Spring Harbor Laboratory).
2020
*Using Legacy CineLyzer with Single Wavelength Multi-Fiber Photometry System
New Features & Improvements Include:
Reduce the Risk of Photobleaching by Configuring ON/OFF Schedule for LEDS

LED Test Mode has been designed to help users to measure and adjust LED output power

For best results, please see our document on Patch cable alignment. This will help ensure the highest power outputs.
New LED Test Mode can be used to:
- Measure output power for each LED
- Adjust the bundle position relative the output beam.
Click to read more about the new LED Test Mode.
Unlock the Added Benefits of Our Enhanced Photometry System

Advanced Software for Photometry Signal Visualization and Behavioral Tracking
- Visualize raw photometry data in real-time
- Heatmaps for each individual fiber illustrate changes in fluorescence during recording
- Define photometry events based on raw photometry signal threshold crossings and combine with behavioral events to identify if a change in florescence occurs during a specified behavior
- Interface with External Equipment
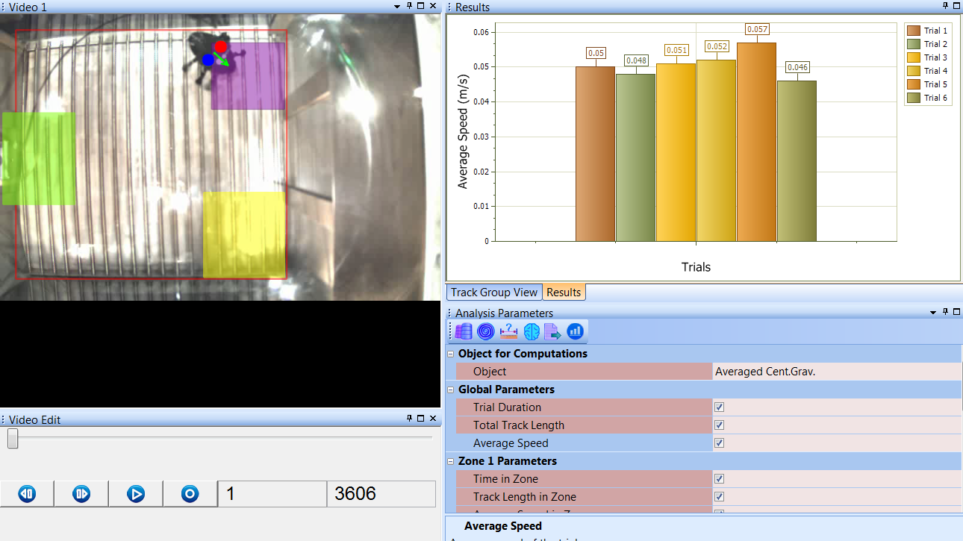
Combined with Behavioral Tracking
Plexon's multi-wavelength photometry system includes our behavioral tracking software. Integrating behavioral tracking provides the information necessary to make correlations between the photometry signal(s) and the subject’s performance on behavioral tasks.
- Create zones and automatically count the number of behavioral events that occur during recording
- Track speed and position of subject
- Set parameters to identify when a defined behavioral event occurs and the photometry signal crosses a defined threshold.
Advanced Software for Photometry Signal Visualization and Behavioral Tracking
- Visualize raw photometry data in real-time
- Heatmaps for each individual fiber illustrate changes in fluorescence during recording
- Define photometry events based on raw photometry signal threshold crossings and combine with behavioral events to identify if a change in florescence occurs during a specified behavior
- Interface with External Equipment
Combined with Behavioral Tracking
Plexon's multi-wavelength photometry system includes our behavioral tracking software. Integrating behavioral tracking provides the information necessary to make correlations between the photometry signal(s) and the subject’s performance on behavioral tasks.
- Create zones and automatically count the number of behavioral events that occur during recording
- Track speed and position of subject
- Set parameters to identify when a defined behavioral event occurs and the photometry signal crosses a defined threshold.
Advanced Software for Photometry Signal Visualization and Behavioral Tracking
- Visualize raw photometry data in real-time
- Heatmaps for each individual fiber illustrate changes in fluorescence during recording
- Define photometry events based on raw photometry signal threshold crossings and combine with behavioral events to identify if a change in florescence occurs during a specified behavior
Combined with Behavioral Tracking
Plexon's multi-wavelength photometry system includes our behavioral tracking software. Integrating behavioral tracking provides the information necessary to make correlations between the photometry signal(s) and the subject’s performance on behavioral tasks.
- Create zones and automatically count the number of behavioral events that occur during recording
- Track speed and position of subject
- Set parameters to identify when a defined behavioral event occurs and the photometry signal crosses a defined threshold.